from matplotlib import pyplot as plt
from tqdm.notebook import tqdmData
Load data from NCH
import pandas as pd


def forecast_long_to_wide(df: pd.DataFrame) -> pd.DataFrame:
    # Quantile column mapping
    col_map = {
        0.025: "2.5 %",
        0.1: "10.0 %",
        0.25: "25.0 %",
        0.5: "50.0 %",
        0.75: "75.0 %",
        0.9: "90.0 %",
        0.975: "97.5 %",
    }

    # Pivot quantile rows
    q = df[df["type"] == "quantile"].copy()
    q["quantile"] = pd.to_numeric(q["quantile"])
    piv = (
        q[q["quantile"].isin(col_map)]
        .pivot(index="forecast_date", columns="quantile", values="value")
        .rename(columns=col_map)
    )

    # Add mean and sd (if present)
    res = piv.copy()
    for name in ["mean", "sd"]:
        m = (
            df[df["type"] == name][["forecast_date", "value"]]
            .drop_duplicates()
            .set_index("forecast_date")
            .rename(columns={"value": name})
        )
        res = res.join(m)

    # Set final column order and output
    cols = [
        "mean",
        "sd",
        "2.5 %",
        "10.0 %",
        "25.0 %",
        "50.0 %",
        "75.0 %",
        "90.0 %",
        "97.5 %",
    ]
    out = res[cols].reset_index().rename(columns={"forecast_date": "date"})
    return out
import os
from pathlib import Path
import shutil
import subprocess
import pandas as pd
# Define repository and local clone directory
repo_url = "https://github.com/KITmetricslab/hospitalization-nowcast-hub.git"
clone_dir = Path("/tmp/hospitalization-nowcast-hub")
def read_nch_model_submissions(model_dir: str) -> pd.DataFrame:
csv_dir_path = clone_dir / model_dir
csv_files = [
csv_dir_path / file
for file in os.listdir(csv_dir_path)
if file.endswith(".csv")
]
dfs = [
pd.read_csv(file_path).assign(filename=file_path.name)
for file_path in csv_files
]
combined_df = pd.concat(dfs, ignore_index=True)
query_string = "".join(
"""
age_group == "00+" and target == "0 day ahead inc hosp" and location == "DE"
""".split(
"\n"
)
)
wide_df = forecast_long_to_wide(
combined_df.query(query_string)[["forecast_date", "type", "quantile", "value"]]
)
wide_df["date"] = pd.to_datetime(wide_df["date"], format="%Y-%m-%d").dt.date
return wide_df
if not clone_dir.exists():
subprocess.run(
["git", "clone", "--depth", "1", repo_url, str(clone_dir)], check=True
)
ilm_prop42_df = read_nch_model_submissions("data-processed_updated_models/ILM-prop42")
nch_ensemble_df = read_nch_model_submissions(
"data-processed_updated_models/NowcastHub-MeanEnsemble40"
)plt.figure(figsize=(12, 6))
plt.plot(ilm_prop42_df["date"], ilm_prop42_df["mean"], label="ILM-prop42")
plt.plot(nch_ensemble_df["date"], nch_ensemble_df["mean"], label="NCH")
plt.legend()
plt.show()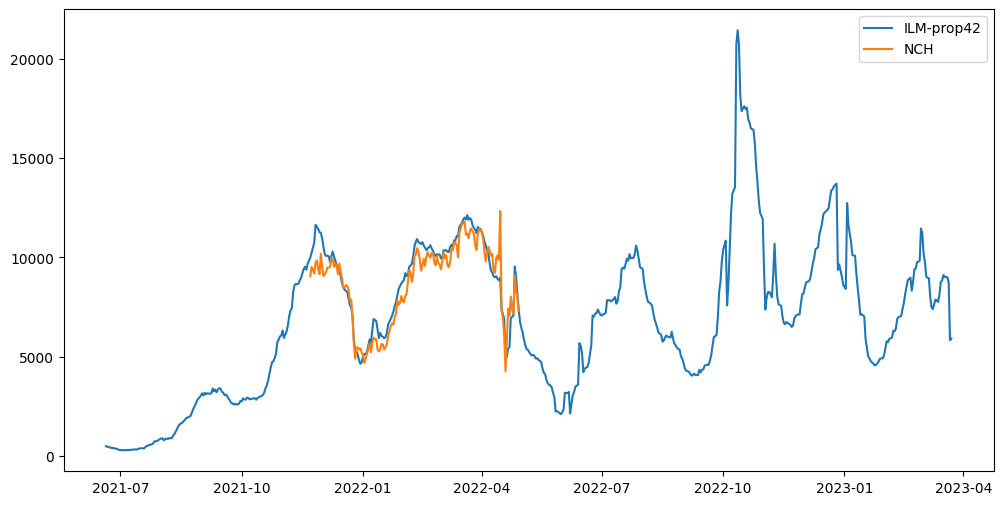
from pyprojroot import here

ilm_prop42_df.to_csv(
    here("data/results/4_hospitalizations/nowcast/ilm_prop42.csv"), index=False
)
nch_ensemble_df.to_csv(
    here("data/results/4_hospitalizations/nowcast/nch_ensemble.csv"), index=False
)